This article describes how to use the Massif heap profiler with GNOME applications. We describe how to invoke, interpret, and act on the output of Massif. The Swell Foop game is used as an example.
Massif is a member of the valgrind suite of memory-profiling tools. Its purpose is to give a detailed view of dynamic memory usage during the lifetime of the program. Specifically it records the memory use of the heap and the stack.
The heap is the region of memory which is allocated with functions like malloc. It grows on demand and is usually the largest region of memory in a program. The stack is where all the local data for functions is stored. This includes the "automatic" variables in C and the return address for subroutines. The stack is typically a lot smaller and a lot more active than the heap. We won't consider the stack explicitly since Massif treats it as though it were just another part of the heap. Massif also gives information about how much memory is used to manage the heap.
Massif produces two output files: a graphical overview in a postscript file and a detailed breakdown in a text file.
Massif has very few options and for many programs does not need them. However for GNOME applications, where memory allocation might be buried deep in either glib or GTK, the number of levels down the call-stack Massif descends needs to be increased. This is achieved using the --depth parameter. By default this is 3; increasing it to 5 will guarantee the call-stack reaches down to your code. One or two more levels may also be desirable to provide your code with some context. Since the level of detail becomes quickly overwhelming it is best to start with the smaller depth parameter and only increase it when it becomes apparent that it isn't sufficient.
It is also useful to tell Massif which functions allocate memory in glib. It removes an unnecessary layer of function calls from the reports and gives you a clearer idea of what code is allocating memory. The allocating functions in glib are g_malloc, g_malloc0, g_realloc, g_try_malloc, and g_mem_chunk_alloc. You use the --alloc-fn option to tell Massif about them.
Your command-line should therefore look something like:
valgrind --tool=massif --depth=5  --alloc-fn=g_malloc --alloc-fn=g_realloc --alloc-fn=g_try_malloc \
         --alloc-fn=g_malloc0 --alloc-fn=g_mem_chunk_alloc swell-foop
Swell Foop is the program we will be using as an example. Be warned that, since valgrind emulates the CPU, it will run very slowly. You will also need a lot of memory.
The graphical output of Massif is largely self explanatory. Each band represents the memory allocated by one function over time. Once you identify which bands are using the most memory, usually the big thick ones at the top you will have to consult the text file for the details.
The text file is arranged as a hierarchy of sections, at the top is a list of the worst memory users arranged in order of decreasing spacetime. Below this are further sections, each breaking the results down into finer detail as you proceed down the call-stack. To illustrate this we will use the output of the command above.
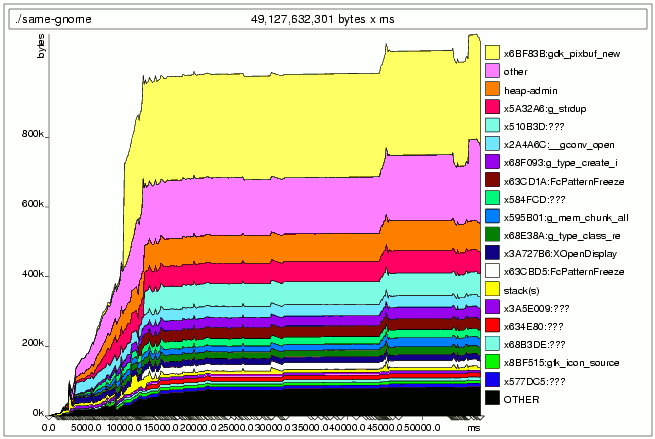
The image above shows a typical postscript output from Massif. This is the result you would get from playing a single game of Swell Foop (version 2.8.0) and then quitting. The postscript file will have a name like massif.12345.ps and the text file will be called massif.12345.txt. The number in the middle is the process ID of the program that was examined. If you actually try this example you will find two versions of each file, with slightly different numbers, this is because Swell Foop starts a second process and Massif follows that too. We will ignore this second process, it consumes very little memory.
At the top of the graph we see a large yellow band labelled gdk_pixbuf_new. This seems like an ideal candidate for optimization, but we will need to use the text file to find out what is calling gdk_pixbuf_new. The top of the text file will look something like this:
Command: ./swell-foop

== 0 ===========================
Heap allocation functions accounted for 90.4% of measured spacetime

Called from:
  28.8% : 0x6BF83A: gdk_pixbuf_new (in /usr/lib/libgdk_pixbuf-2.0.so.0.400.9)

    6.1% : 0x5A32A5: g_strdup (in /usr/lib/libglib-2.0.so.0.400.6)

    5.9% : 0x510B3C: (within /usr/lib/libfreetype.so.6.3.7)

    3.5% : 0x2A4A6B: __gconv_open (in /lib/tls/libc-2.3.3.so)
The line with the '=' signs indicates how far down the stack trace we are, in this case we are at the top. After this it lists the heaviest users of memory in order of decreasing spacetime. Spacetime is the product of the amount of memory used and how long it was used for. It corresponds to the area of the bands in the graph. This part of the file tells us what we already know: most of the spacetime is dedicated to gdk_pixbuf_new. To find out what called gdk_pixbuf_new we need to search further down the text file:
== 4 ===========================
Context accounted for 28.8% of measured spacetime
  0x6BF83A: gdk_pixbuf_new (in /usr/lib/libgdk_pixbuf-2.0.so.0.400.9)
  0x3A998998: (within /usr/lib/gtk-2.0/2.4.0/loaders/libpixbufloader-png.so)
  0x6C2760: (within /usr/lib/libgdk_pixbuf-2.0.so.0.400.9)
  0x6C285E: gdk_pixbuf_new_from_file (in /usr/lib/libgdk_pixbuf-2.0.so.0.400.9)

Called from:
  27.8% : 0x804C1A3: load_scenario (swell-foop.c:463)

    0.9% : 0x3E8095E: (within /usr/lib/libgnomeui-2.so.0.792.0)

  and 1 other insignificant place
The first line tells us we are now four levels deep into the stack. Below it is a listing of the function calls that leads from here to gdk_pixbuf_new. Finally there is a list of functions that are at the next level down and call these functions. There are, of course, also entries for levels 1, 2, and 3, but this is the first level to reach right down through the GDK code to the Swell Foop code. From this listing, we can see instantly that the problem code is load_scenario.
Now that we know what part of our code is using all the spacetime we can look at it and find out why. It turns out that the load_scenario is loading a pixbuf from file and then never freeing that memory. Having identified the problem code, we can start to fix it.
Reducing spacetime consumption is good, but there are two ways of reducing it and they are not equal. You can either reduce the amount of memory allocated, or reduce the amount of time it is allocated for. Consider for a moment a model system with only two processes running. Both processes use up almost all the physical RAM and if they overlap at all then the system will swap and everything will slow down. Obviously if we reduce the memory usage of each process by a factor of two then they can peacefully coexist without the need for swapping. If instead we reduce the time the memory is allocated by a factor of two then the two programs can coexist, but only as long as their periods of high memory use don't overlap. So it is better to reduce the amount of memory allocated.
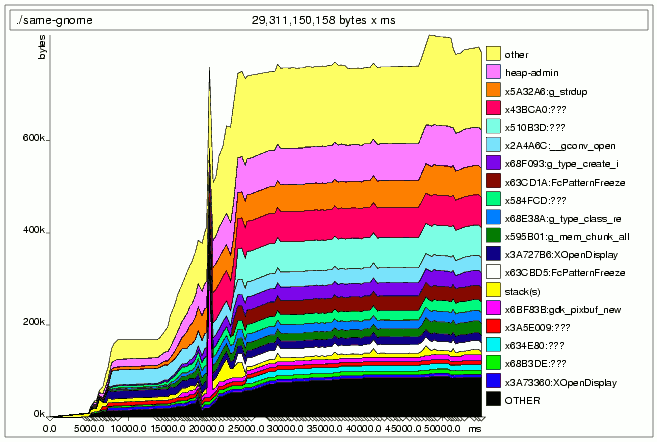
Unfortunately, the choice of optimization is also constrained by the needs of the program. The size of the pixbuf data in Swell Foop is determined by the size of the game's graphics and cannot be easily reduced. However, the amount of time it spends loaded into memory can be drastically reduced. The image below shows the Massif analysis of Swell Foop after being altered to dispose of the pixbufs once the images have been loaded into the X server.
The spacetime use of gdk_pixbuf_new is now a thin band that only spikes briefly (it is now the sixteenth band down and shaded magenta). As a bonus, the peak memory use has dropped by 200 kB since the spike occurs before other memory is allocated. If two processes like this were run together the chances of the peak memory usage coinciding, and hence the risk of swapping, would be quite low.
Can we do better ? A quick examination of Massif's text output reveals: g_strdup to be the new major offender.
Command: ./swell-foop

== 0 ===========================
Heap allocation functions accounted for 87.6% of measured spacetime

Called from:
    7.7% : 0x5A32A5: g_strdup (in /usr/lib/libglib-2.0.so.0.400.6)

    7.6% : 0x43BC9F: (within /usr/lib/libgdk-x11-2.0.so.0.400.9)

    6.9% : 0x510B3C: (within /usr/lib/libfreetype.so.6.3.7)

    5.2% : 0x2A4A6B: __gconv_open (in /lib/tls/libc-2.3.3.so)
If we look closer though we see that it is called from many, many, places.
== 1 ===========================
Context accounted for  7.7% of measured spacetime
  0x5A32A5: g_strdup (in /usr/lib/libglib-2.0.so.0.400.6)

Called from:
    1.8% : 0x8BF606: gtk_icon_source_copy (in /usr/lib/libgtk-x11-2.0.so.0.400.9)

    1.1% : 0x67AF6B: g_param_spec_internal (in /usr/lib/libgobject-2.0.so.0.400.6)

    0.9% : 0x91FCFC: (within /usr/lib/libgtk-x11-2.0.so.0.400.9)

    0.8% : 0x57EEBF: g_quark_from_string (in /usr/lib/libglib-2.0.so.0.400.6)

  and 155 other insignificant places
We now face diminishing returns for our optimization efforts. The graph hints at another possible approach: Both the "other" and "heap admin" bands are quite large. This tells us that there are a lot of small allocations being made from a variety of places. Eliminating these will be difficult, but if they can be grouped then the individual allocations can be larger and the "heap admin" overhead can be reduced.
There are a couple of things to watch out for: Firstly, spacetime is only reported as a percentage, you have to compare it to the overall size of the program to decide if the amount of memory is worth pursuing. The graph, with its kilobyte vertical axis, is good for this.
Secondly, Massif only takes into account the memory used by your own program. Resources like pixmaps are stored in the X server and aren't considered by Massif. In the Swell Foop example we have actually only moved the memory consumption from client-side pixbufs to server-side pixmaps. Even though we cheated there are performance gains. Keeping the image data in the X server makes the graphics routines quicker and removes a lot of inter-process communication. Also, the pixmaps will be stored in a native graphics format which is often more compact than the 32-bit RGBA format used by gdk_pixbuf. To measure the effect of pixmaps, and other X resources use the xrestop program.
Got a comment? Spotted an error? Found the instructions unclear? Send feedback about this page.