Tracé de courbes
Outre la possibilité de tracer des droites, Cairo vous permet de tracer facilement des lignes courbes (techniquement une courbe de Bézier d'ordre 3) avec les fonctions Cairo::Context::curve_to() et Cairo::Context::rel_curve_to(). Ces fonctions prennent en paramètres les coordonnées des extrémités ainsi que celles de deux points de « contrôle ». Ce sera plus facile à expliquer sur un exemple, alors lançons-nous.
- XVI.III.I. Exemple
XVI.III.I. Exemple
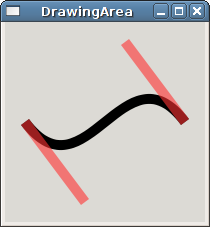
Cette simple application trace une courbe avec Cairo et affiche les points de contrôle pour chaque extrémité de la courbe.
File: myarea.h (For use with gtkmm 4)
#ifndef GTKMM_EXAMPLE_MYAREA_H
#define GTKMM_EXAMPLE_MYAREA_H

#include <gtkmm/drawingarea.h>

class MyArea : public Gtk::DrawingArea
{
public:
  MyArea();
  virtual ~MyArea();

protected:
  void on_draw(const Cairo::RefPtr<Cairo::Context>& cr, int width, int height);
};

#endif // GTKMM_EXAMPLE_MYAREA_H
File: main.cc (For use with gtkmm 4)
#include "myarea.h"
#include <gtkmm/application.h>
#include <gtkmm/window.h>

class ExampleWindow : public Gtk::Window
{
public:
  ExampleWindow();

protected:
  MyArea m_area;
};

ExampleWindow::ExampleWindow()
{
  set_title("DrawingArea");
  set_child(m_area);
}

int main(int argc, char** argv)
{
  auto app = Gtk::Application::create("org.gtkmm.example");

  return app->make_window_and_run<ExampleWindow>(argc, argv);
}
File: myarea.cc (For use with gtkmm 4)
#include "myarea.h"
#include <cairomm/context.h>

MyArea::MyArea()
{
  set_draw_func(sigc::mem_fun(*this, &MyArea::on_draw));
}

MyArea::~MyArea()
{
}

void MyArea::on_draw(const Cairo::RefPtr<Cairo::Context>& cr, int width, int height)
{
  double x0=0.1, y0=0.5, // start point
         x1=0.4, y1=0.9,  // control point #1
         x2=0.6, y2=0.1,  // control point #2
         x3=0.9, y3=0.5;  // end point

  // scale to unit square (0 to 1 width and height)
  cr->scale(width, height);

  cr->set_line_width(0.05);
  // draw curve
  cr->move_to(x0, y0);
  cr->curve_to(x1, y1, x2, y2, x3, y3);
  cr->stroke();
  // show control points
  cr->set_source_rgba(1, 0.2, 0.2, 0.6);
  cr->move_to(x0, y0);
  cr->line_to (x1, y1);
  cr->move_to(x2, y2);
  cr->line_to (x3, y3);
  cr->stroke();
}
The only difference between this example and the straight line example is in the on_draw() function, but there are a few new concepts and functions introduced here, so let's examine them briefly.
We make a call to Cairo::Context::scale(), passing in the width and height of the drawing area. This scales the user-space coordinate system such that the width and height of the widget are both equal to 1.0 'units'. There's no particular reason to scale the coordinate system in this case, but sometimes it can make drawing operations easier.
The call to Cairo::Context::curve_to() should be fairly self-explanatory. The first pair of coordinates define the control point for the beginning of the curve. The second set of coordinates define the control point for the end of the curve, and the last set of coordinates define the destination point. To make the concept of control points a bit easier to visualize, a line has been drawn from each control point to the end-point on the curve that it is associated with. Note that these control point lines are both translucent. This is achieved with a variant of set_source_rgb() called set_source_rgba(). This function takes a fourth argument specifying the alpha value of the color (valid values are between 0 and 1).